 |
|

How can I see a graphical report of how my company is doing?
If you want to see a graphical report of how your
company is doing then just follow the steps below.
1. Click the Reports drop down menu.
2. Select Graphical Reports.
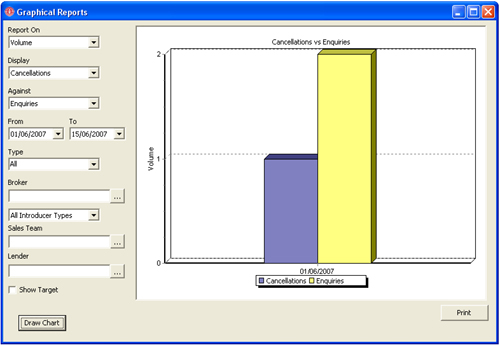
3. This will open the Graphical reporting screen.
4. Choose what you want to compare i.e. Enquiries against Completions.
5. Select the dates From and To. This will show case during this period of time.
6. Select whether you want to show all kinds of loans or whether it be just Mortgages,
Commercial Mortgages or Secured Loans.
7. Once you have fine tuned your report click to Draw Chart.
8. This will then draw the chart as shown below.
Back to FAQ
|
|
|